
P3 Bar Graphs: Reading Scales and Answering Questions
Help your child read P3 bar graphs accurately, use different scales and solve total and comparison questions with worked examples and simple checking habits.

P3 bar graphs work teaches children to read values from a scale and use those values to answer questions. This guide helps parents explain the labels, intervals and calculations through four worked examples.
A child can identify the tallest bar and still misread its value. Before doing any arithmetic, check what each space on the scale represents and what quantity the graph records.
Key Takeaways
Read the title and labels before interpreting a bar.
Equal spaces on the numerical axis represent equal increases in value.
Six intervals of five represent 30, not six.
Read the required values first, then decide whether to add, subtract or compare.
Keep conclusions within what the graph actually records.
What the P3 bar graphs topic includes
The MOE Primary Mathematics syllabus includes reading and interpreting bar graphs with different axis scales. The West Spring Primary P3 overview lists bar graphs among the year's topics.
This guide focuses on reading values, comparisons and simple calculations. Creating a small graph at home is an optional way to explore how scales work. It is not presented as a separate compulsory syllabus outcome.
Our P3 Maths overview connects graph reading with number skills and the other topics children meet during the year.
Read the graph before reading the question's numbers
A bar graph represents categories using bars. In a vertical graph, categories are usually named below the bars and values are read from the vertical axis. In a horizontal graph, the numerical scale usually runs across the page.
Begin with three questions:
What does the title say is being recorded?
What does each category label refer to?
How much does each equal interval on the numerical scale represent?
The third question deserves a pause. A scale labelled 0, 5, 10, 15 and 20 increases by five between adjacent labels. A bar ending at the fourth interval above zero represents 20.
Count the spaces between marks, not the marks themselves. Between 0 and 10 there can be two intervals of five: 0 to 5, then 5 to 10. There are three labelled marks, but only two intervals.
Read values before comparing lengths
Within one graph using a common scale and baseline, a taller bar represents a greater amount. However, the number of items between two bars depends on the scale.
If one bar is two intervals taller and each interval represents five books, the difference is ten books. If the intervals represent ten books, the same two-interval gap means twenty books.
Do not carry a scale from the previous question into a new graph. Read it again. The picture may look familiar while the values have changed.
A practice graph to use with the examples
The following original practice graph records books borrowed from four sections of a class library during one week. Each book is counted in one section only. The data are invented for learning, not taken from a real school survey.
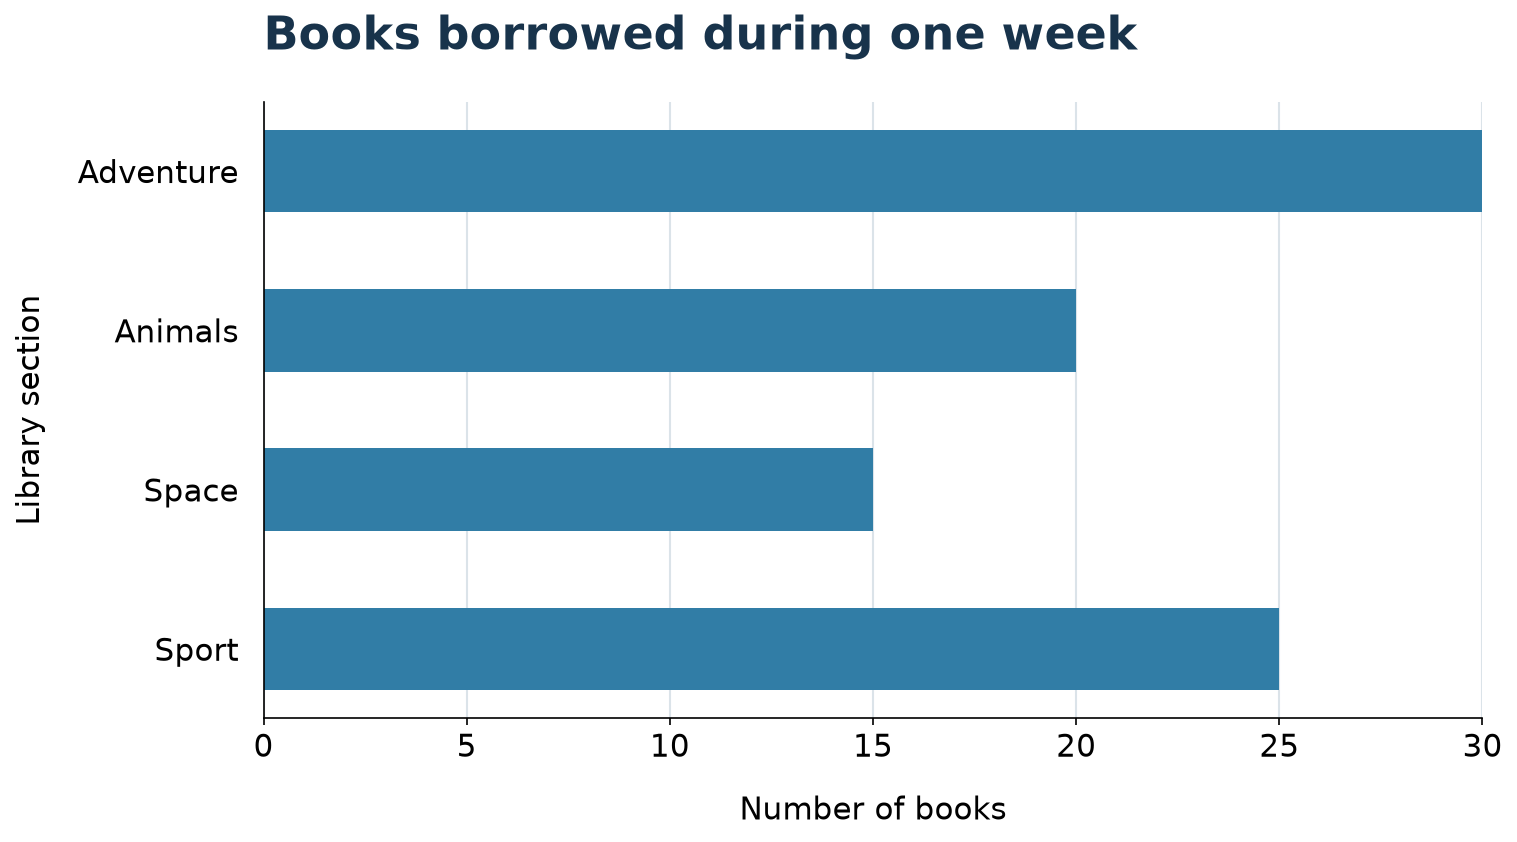
Read each bar's end against the scale. The values are repeated here so parents can check the reading before moving to the questions.
Section | Books borrowed |
Adventure | 30 |
Animals | 20 |
Space | 15 |
Sport | 25 |
Keep the graph's meaning precise. It counts books borrowed, not different children. One child could have borrowed more than one book during the week.
Worked questions on P3 bar graphs
These are original questions with suggested solutions. Each example shows how to move from the graph to the relevant values, then to the answer.
Example 1: Read a bar using the scale
How many books were borrowed from the Sport section?
Find Sport on the category axis and follow its bar to the end. Its end aligns with 25 on the numerical scale.
Another way to read it is to count five intervals from zero. Each interval represents five books:
5 × 5 = 25 books
Suggested answer: “25 books were borrowed from the Sport section.”
Check against the labelled tick mark. The answer is 25 books, not five books. Five is the number of intervals; 25 is the quantity represented.
This direct reading question does not need a bar model or several calculations. The useful working is the scale interpretation.
Example 2: Find a difference
How many more Adventure books than Space books were borrowed?
Read both values before subtracting: Adventure shows 30 books and Space shows 15 books. The question asks for the extra amount represented by Adventure.
30 − 15 = 15 books
Suggested answer: “15 more Adventure books than Space books were borrowed.”
Check by adding the difference to the smaller amount: 15 + 15 = 30. On the graph, the gap is three intervals, each representing five books, so it also represents 15 books.
If your child adds the bars to get 45, ask them to point to the extra portion of the Adventure bar beyond the Space value. That visible gap matches the subtraction.
Example 3: Combine selected categories
How many books were borrowed from the Animals and Sport sections altogether?
Only two categories are requested. Read Animals as 20 books and Sport as 25 books, then combine them:
20 + 25 = 45 books
Suggested answer: “45 books were borrowed from the Animals and Sport sections altogether.”
Check that both requested categories appear in the working and neither of the other sections has been added. Then use subtraction to check the total: 45 − 25 = 20.
The answer can be larger than the maximum value printed on the graph's axis. The axis shows individual section values; it does not limit the total of several sections.
For more support with deciding between a total and a comparison, see our whole numbers and four operations guide.
Example 4: Apply a different scale
A second graph shows the number of exercise books in three boxes. Its numerical axis is labelled 0, 10, 20, 30, 40 and 50 at equal intervals. The bars for A, B and C end at 20, 40 and 50. How many exercise books are in the three boxes altogether?
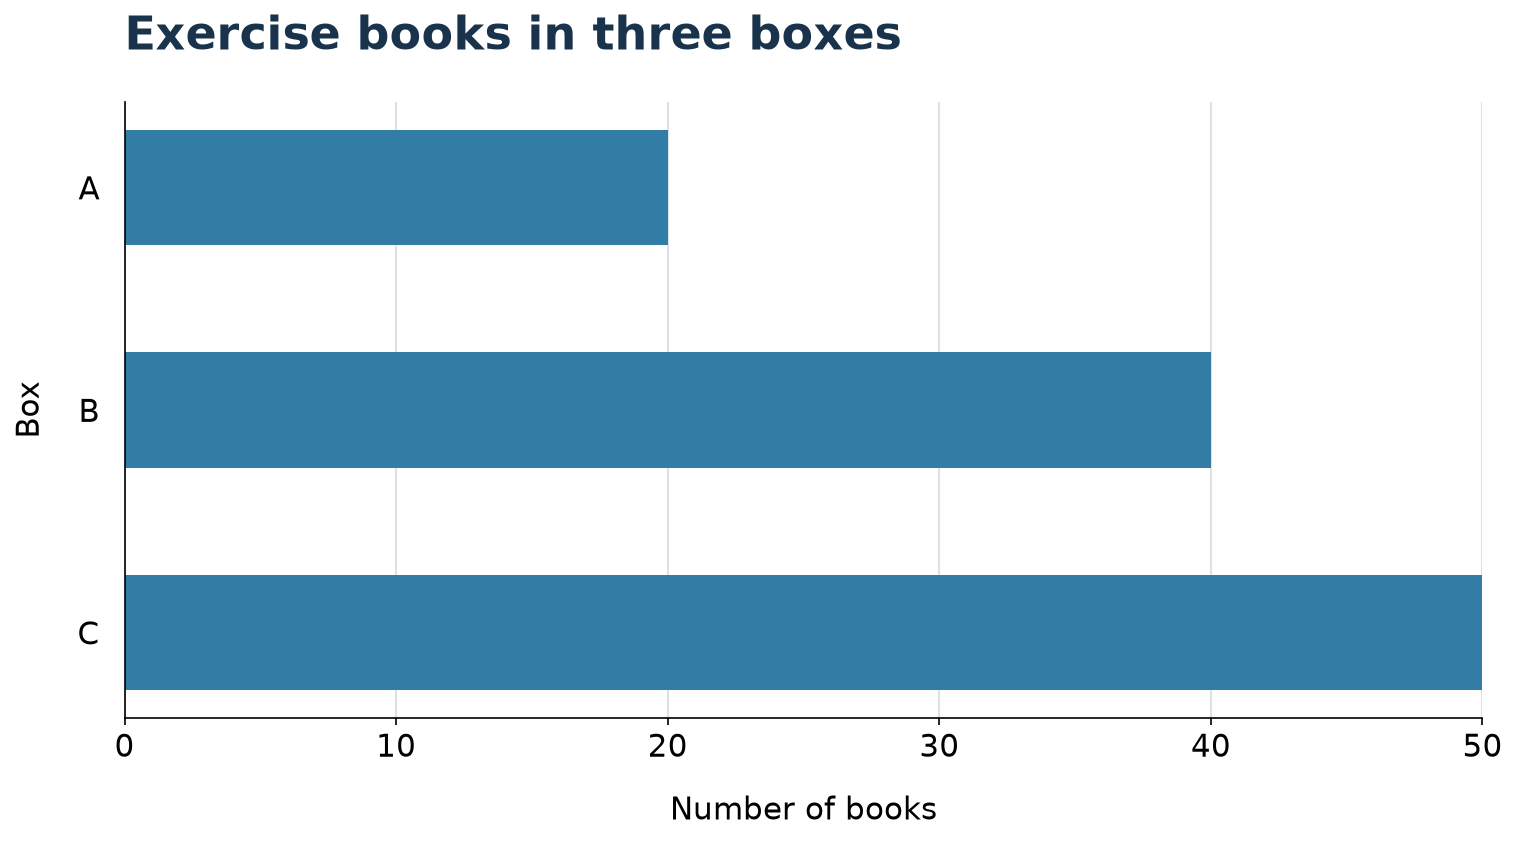
This scale increases by ten per interval. Read the values from the new graph:
20 + 40 + 50 = 110 exercise books
Suggested answer: “There are 110 exercise books in the three boxes altogether.”
Check by counting the intervals: two for A, four for B and five for C makes eleven intervals of ten, or 110 books.
Do not reuse the first graph's five-book intervals. That would halve every value. The category labels, graph title and numerical axis together tell you what each bar means.
Common mistakes and what to ask next
Mistake | A useful question |
Counting intervals as items | “How many books does one interval stand for?” |
Reading the neighbouring bar | “Which category does the question name?” |
Adding every category | “Which sections are included in this total?” |
Giving a category name when a number is requested | “Does it ask which section, or how many books?” |
Assuming the scale remains unchanged | “What are the first two numbers on this graph's axis?” |
A different mistake is claiming more than the data show. From the first graph, Adventure has the most books borrowed that week. That does not prove every pupil prefers Adventure or that Adventure books are better. The graph records borrowing, not each child's opinion.
The total number of books borrowed also does not tell us how many children borrowed them. To answer that question, we would need information about individual borrowers.
Make a small graph together
Choose a collection with clear categories, such as red, blue and green pencils. Count the pencils first and record the values. Let your child draw a simple bar for each category on squared paper.
Start with one square representing one pencil. Give the graph a title and label both axes. Ask one reading question, one comparison and one total. This lets your child see how the table of counts becomes a graph.
For another practice graph, use imaginary counts of 10, 20 and 30 and let each equal interval represent five. Discuss why the bars now take fewer intervals than a scale of one would need. The quantities stay the same; only the representation changes.
Keep bars equally wide and start them at the same zero baseline. Those choices make the scale easier to interpret. Encourage your child to check every bar against the original count before writing questions for you to answer.
Frequently asked questions
Should my child always count every interval?
No. If a bar ends at a labelled tick, they can read that value directly. Counting intervals is useful when checking the scale or explaining why a value is correct.
Can bar graphs run sideways?
Yes. Horizontal bars represent values through their lengths. Read the numerical axis and category labels rather than assuming numbers must run up the page.
Is the tallest bar always the answer?
Only if the question asks for the greatest amount. A question about a difference or combined total requires reading the relevant values and doing the appropriate calculation.
Do we need averages or percentages for this topic?
No. The P3 questions in this guide use graph reading and whole-number calculations. Keep the focus on interpreting the scale and answering the question given.
How Ottodot supports graph-reading habits
Ottodot's Lower Primary Math classes use guided explanations and practice with checking routines. Teachers help children identify the requested quantity before calculating.
Game-based practice and weekly homework follow the teacher-led explanation.
If your child can add and subtract but often misreads the information first, Check my child's fit to explore suitable support.