
P2 Picture Graphs with Scales: Worked Examples
Read P2 picture graphs with scales using four worked examples. Learn to use the key, compare groups, find totals and check the number each picture represents.

P2 picture graphs with scales use a key to tell us how many items each picture represents. To answer a question, read the key, find the values for the named groups and then decide whether to compare, add or subtract them.
Counting four pictures is only part of the job. If one picture stands for two books, that row represents eight books. The four examples below show how to explain that extra step and check the answer.
Key Takeaways
The key gives the value of one picture.
Four pictures can represent eight items when the key says two per picture.
Find each group's value before adding or comparing.
A new graph may use a different key, even if its pictures look familiar.
Keep the answer's unit, such as books or children, attached to the number.
What P2 picture graphs with scales ask children to do
The MOE Primary Mathematics syllabus includes reading and interpreting scaled picture graphs in P2. The examples below use whole symbols with clearly stated values.
The Primary 2 Maths overview shows how graph reading fits alongside number work. Tables and repeated addition help children calculate the value of a row, but they must first understand what the graph represents.
Read the title, labels and key together
Start with the title. “Books collected” tells us what has been counted. Then read the row labels so we know whose books each row represents.
Finally, read the key aloud as a complete statement: “One picture represents two books.” Avoid shortening it to “the key is two”. The full statement connects the picture to its value and unit.
Ask your child to point to one picture and tell you its value. Then point to two pictures. If they say “two books” for the second answer, pause before doing a word problem. They are still treating each symbol as one item.
Repeated addition helps make the groups visible. Four symbols with two books each can be read as 2 + 2 + 2 + 2. Multiplication records the same equal groups more briefly.
Keep two counts separate
There is a count of symbols and a count of the things those symbols represent. A clear explanation names both: “I see four symbols. Each represents two books. That makes eight books.”
The symbol need not look exactly like the item being counted. A square can represent books, pupils or tickets if the graph states what it means. Don't infer the unit from the picture alone.
A graph to use for the first three examples
The graph below shows books collected by three teams. It is an original practice dataset, not a report of a real school's activity. Each book belongs to only one team's total.
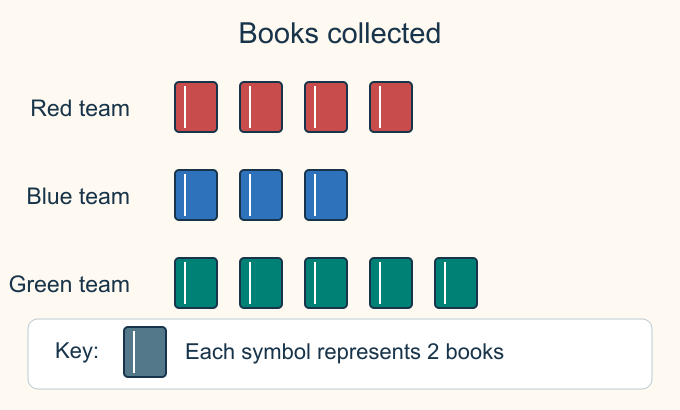
Team | Symbols | Books per symbol | Books collected |
Red | 4 | 2 | 8 |
Blue | 3 | 2 | 6 |
Green | 5 | 2 | 10 |
The table repeats the values for checking. When practising, you can cover its final column and ask your child to work out one row at a time. Keep the key visible throughout.
Four worked examples
Example 1: Read a row using its key
How many books did the Red team collect?
Understand and plan: The question asks for books, not symbols. Find the Red team's row and count its four symbols. Each stands for two books.
Working:
2 + 2 + 2 + 2 = 8
Or: 4 × 2 = 8
Answer: The Red team collected 8 books.
Check: Point to each symbol and count in twos: 2, 4, 6, 8. Stop at the last Red symbol. Counting the symbol in the key as part of the row would add books that do not belong to the team's data.
If your child answers “4”, ask “Four what?” Their symbol count is correct; it is the translation from symbols to books that needs attention.
Example 2: Find how many more
How many more books did the Green team collect than the Blue team?
Understand and plan: Read both team values before finding their difference. Green has five symbols, representing ten books. Blue has three, representing six books.
Working:
10 − 6 = 4
Answer: The Green team collected 4 more books than the Blue team.
Check: Six books plus four books makes ten books. We can also match three Green symbols with the three Blue symbols. Two Green symbols remain unmatched, and each represents two books. That is another way to see the difference of four.
An answer of “2 more” confuses the symbol difference with the book difference. Matching symbols can be helpful, but the final answer still needs the scale.
Example 3: Find the combined total
How many books did all three teams collect altogether?
Understand and plan: The word “all” includes Red, Blue and Green. Add their book totals, keeping track of each row once.
Working:
8 + 6 = 14
14 + 10 = 24
Answer: The three teams collected 24 books altogether.
Check: Count the symbols across the three rows: 4 + 3 + 5 = 12 symbols. With two books represented by each symbol, twelve groups of two give 24 books. You can count in twos rather than requiring recall of a new table fact.
The two methods agree because the key is the same for every row in this graph. If different diagrams use different keys, their raw symbol counts cannot be combined in the same way.
Example 4: Read a different scale
A new graph shows books collected by the Yellow team. It has three symbols, and each symbol represents five books. How many books did the team collect?
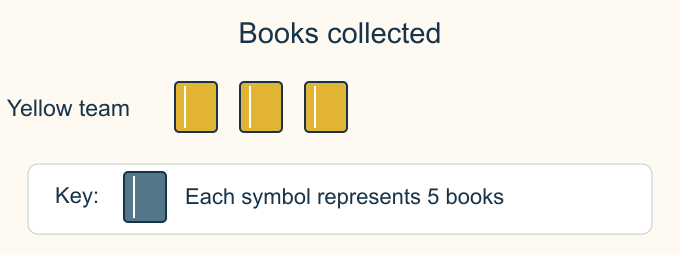
Understand and plan: This is a new graph. Its key is five books per symbol, so the earlier value of two no longer applies.
Working:
5 + 5 + 5 = 15
Or: 3 × 5 = 15
Answer: The Yellow team collected 15 books.
Check: Read the new key again and count 5, 10, 15 while pointing to the three symbols. An answer of six would come from carrying over the previous graph's key.
The Yellow row has fewer symbols than the Green row in the first graph, yet represents more books. Comparing row lengths across different scales can therefore give the wrong conclusion.
Common mistakes and how to correct them
Ignoring the key. Cover the questions briefly and ask what one symbol means. Then ask what two symbols mean. Make this a habit with each new graph.
Counting the key symbol as data. Trace the row with a finger. The symbol printed beside the key explains the scale; it is not an extra book collection.
Answering for the wrong team. Read the row label before counting. If several colours are used, labels still matter, especially when a graph is printed without colour.
Using a correct calculation with incorrect values. Check the graph readings first. A perfectly calculated difference between two misread numbers still answers the wrong question.
Making a claim the graph cannot support. More books collected does not tell us which team worked hardest or how many children took part. Those facts would need additional information.
Practise with a small home graph
Arrange toy blocks in equal groups of two. Put one paper symbol beside each pair and write a key. Ask your child to count the blocks, then cover them and read the symbol graph. The quantities should agree.
For a second round, use groups of five and rewrite the key. Deliberately keep the same symbol so your child has to consult its meaning rather than assume it.
Try a brief explanation prompt: “How do you know the row shows ten?” Accept pointing and repeated addition before asking for a multiplication sentence. Once your child can explain the groups, a number sentence records that thinking briefly. Our P2 multiplication and division guide gives more examples of equal groups.
Frequently asked questions
Does one picture always mean one item?
No. The key defines the value. In the first graph here, a symbol means two books; in the second, it means five.
Can my child use repeated addition?
Yes. Repeated addition shows the equal groups clearly. Connect it to a multiplication sentence once your child understands what each group represents.
Should we introduce half symbols immediately?
Start with whole symbols and the tasks used at school. If a later question includes a half symbol, explain its value from the stated key before calculating.
Is the row with the most symbols always the largest amount?
Within one graph where every row uses the same key, it is. Across separate graphs with different keys, compare the represented values instead.
Help your child explain what the pictures mean
If your child gets the arithmetic right but repeatedly misreads a graph, return to the key and row labels. Ask for one complete explanation before adding more questions.
Ottodot's Lower Primary Math classes combine teacher explanations and worked examples with Roblox-based practice. For support with connecting pictures, quantities and number sentences, Check my child’s fit.