
P1 Picture Graphs: Reading and Comparing Data
Help your child read P1 picture graphs, compare groups and find totals with a labelled fruit graph, four worked examples and practical questions for home.
P1 picture graphs use pictures to show quantities in different groups. Children read the title, labels and key, then use the information to answer questions about amounts, differences and totals.
In the graph below, each picture stands for one child. The four worked examples show how to move from counting pictures to explaining an answer, without guessing from the length of a row.
Key Takeaways
Read what the graph records before counting.
Check what one picture represents.
Match the question to the correct category.
“Which fruit?” asks for a name; “how many children?” asks for a quantity.
The key symbol explains the graph; it is not part of the data.
What P1 picture graphs teach
The MOE Primary Mathematics syllabus includes reading and interpreting picture graphs at P1. This guide uses one picture for one item. Scaled picture graphs, where a picture can represent several items, are covered at P2.
For connections with the other topics, see our Primary 1 Maths overview. Graph questions draw on counting, addition and subtraction, but choosing the right information comes first.
Your child might do the addition correctly after reading the wrong row. Before asking for a number sentence, ask them to point to the category named in the question. That small step helps reveal whether the difficulty is reading the graph or calculating with its values.
A favourite-fruit graph
This original practice graph shows the favourite fruit selected by 13 children. Each child chooses one fruit from the three options. The numbers are invented for practice and do not describe a real class survey.
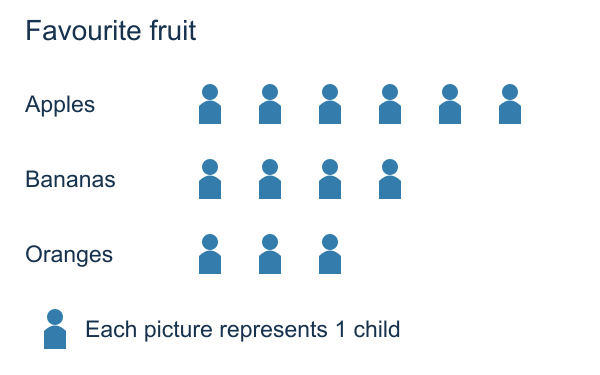
The title tells us the graph concerns favourite fruit. The labels identify apples, bananas and oranges. The key says one person symbol represents one child. The symbols count children who made a choice, not pieces of fruit they ate.
Fruit chosen | Number of children |
Apples | 6 |
Bananas | 4 |
Oranges | 3 |
Use the table to check your child's reading after they have tried the graph. It repeats the same information in numbers; it is not another group of children to add.
Read a row carefully
Point to Apples and follow its row across. Touch each symbol once while counting. Then stop at the end of that row. Starting again at Bananas means reading a new category.
All symbols in the graph use the same size and spacing. This makes the amounts easier to compare. Even so, counting the symbols is a safer explanation than saying, “That row looks longer.” A poorly drawn graph could have wider gaps without representing more children.
The key below the rows includes one example symbol. Do not count it as another child's vote. It explains how the graph works, just as a ruler label explains a measurement rather than adding length.
Four worked examples
Example 1: Read the bananas category
Question: How many children chose bananas?
Working: Find the Bananas label. Count the four symbols in that row. Each represents one child.
Answer: 4 children chose bananas.
Check: Touch each of the four symbols once and say the counting words aloud. Make sure the count stays in the Bananas row.
No addition or subtraction is needed here. The answer is read directly from one category. If your child begins combining rows, reread the question and underline the single fruit named.
An answer of “bananas” identifies the category but does not answer “how many”. Encourage the full sentence so the number and what it counts stay together.
Example 2: Find the most popular choice in this graph
Question: Which fruit was chosen by the most children?
Working: Read all three counts: apples has six, bananas has four, and oranges has three. Six is the greatest number.
Answer: Apples was chosen by the most children in this graph.
Check: Compare six with each other count. Six is greater than four and greater than three.
The question asks for a fruit, so the final answer must name apples. Writing “6 children” alone gives the largest count but leaves out the requested category.
Keep the conclusion within the graph. We can say apples was the most selected option among these 13 children. We cannot conclude that all children everywhere prefer apples or that apples is everyone's favourite food.
Example 3: Compare apples and oranges
Question: How many more children chose apples than oranges?
Working: Apples has six children and oranges has three. Match three apple-row symbols with the three orange-row symbols. Three symbols in the apple row remain unmatched.
6 − 3 = 3
Answer: 3 more children chose apples than oranges.
Check: Add the difference to the smaller count: 3 + 3 = 6. This returns the apple count.
Adding six and three would give the total for those two categories. The question asks for the extra amount in one category, so subtraction fits. Ask your child to point to the unmatched symbols before they write the number sentence.
For more practice with this relationship, see the sticker comparison in our P1 number bonds, addition and subtraction guide.
Example 4: Find the total number of children
Question: How many children made a choice altogether?
Working: Every child chose one fruit, so count each of the three categories once. Add the counts for apples, bananas and oranges.
6 + 4 + 3 = 13
One useful grouping is 6 + 4 = 10, followed by 10 + 3 = 13.
Answer: 13 children made a choice altogether.
Check: Count all the symbols in the data rows. There are thirteen. Leave out the example symbol beside the key.
The instruction that each child chooses one fruit matters. If children could choose several fruits, the total number of choices would not necessarily equal the number of different children. Here the one-choice rule lets us interpret the sum as children.
Common mistakes and what to ask
If your child counts the key symbol, point out where the labelled rows begin and end. Ask, “Does this symbol belong to Apples, Bananas or Oranges?” The key symbol belongs to none of them; it explains the counting rule.
If they give a number when a name is requested, reread the opening words. “Which fruit?” calls for a category. “How many children?” calls for a count. Both may require looking at the same row but lead to different answers.
When the child adds for every question, ask what the answer should describe. Is it one group, two groups together or the gap between groups? Let them show the requested part of the graph before calculating.
If they skip or double-count symbols, cover the other rows with paper and touch each visible symbol once. Remove the cover when they can keep track. The goal is to help them read the information independently, not to make them work faster at once.
Make a small graph at home
Choose three categories of objects, such as red, blue and green counters. Use four red, two blue and three green counters. Sort and count the real objects first. Then draw one symbol for each counter beside the matching label.
Give the graph a title and a key: one symbol represents one counter. Ask which colour has the fewest counters, how many more red than blue there are, and how many counters there are altogether. The answers are blue, two more and nine altogether.
You can arrange the categories in columns for a second version, or keep the horizontal rows used in this guide. Ask your child to find the labels before counting. Changing the layout should not change the recorded quantities.
Let your child ask you a question about the graph. Give an answer that uses the wrong category on purpose, then invite them to show you where to look. This gives a concrete reason to explain the labels rather than only announce a number.
Frequently asked questions
Does one picture always represent one item?
No. Always read the key. This P1 guide uses one picture for one item. Later scaled graphs can use one picture for several items, so the habit of checking the key remains useful.
Must picture graphs use pictures of the object counted?
No. A symbol can represent a child, book or other item if the key clearly states its meaning. In this guide, person symbols represent children who chose a fruit.
Can the categories run across the bottom?
Yes. Picture graphs can have different layouts. Read each category label and follow its row or column. The location of the pictures does not replace the need to check their meaning.
What if my child counts correctly but chooses the wrong operation?
Ask them to point to what the question asks for before writing a calculation. Matching objects helps with a difference; gathering the requested categories helps with a total.
Support with finding the right information
If your child calculates correctly but repeatedly reads the wrong row or answers a different question, practise explaining the graph before doing sums. Ottodot's Lower Primary Math classes combine teacher explanations with Roblox-based practice.
To explore whether this format suits your child, Check my child’s fit.